- EUR/USD reverses the recent gains ahead of the Fed policy decision.
- MACD line lies above the signal line; suggesting a potential shift in momentum.
- A firm break above the 50-day EMA at 1.0654 could revisit October’s low.
EUR/USD moves downward after recent gains, hovering below 1.0600 during the Asian session on Tuesday. The pair could receive support near the psychological level at 1.0550, followed by the previous week’s low at 1.0521.
A firm break below the latter could open the doors for the EUR/USD pair to navigate the area around the key level at 1.0500.
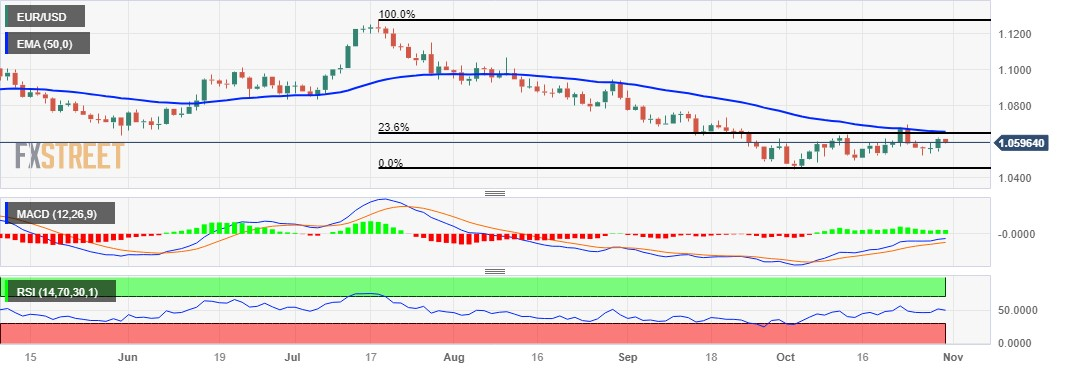
The market’s prevailing expectation that the US Federal Reserve will maintain interest rates at 5.5% in the upcoming policy meeting is anticipated to have a weakening effect on the US Dollar (USD). On the upside, the 23.6% Fibonacci retracement at 1.0643 emerges as the immediate resistance, followed by the 50-day Exponential Moving Average (EMA) at 1.0654.
A breakthrough above the latter could inspire the bulls of the EUR/USD to revisit the monthly low at the 1.0694 level.
The technical analysis for the EUR/USD pair reveals interesting dynamics. The Moving Average Convergence Divergence (MACD) line remains below the centerline but above the signal line, indicating a potential shift in momentum. This suggests a nuanced market sentiment, with elements of change in the trend.
Additionally, the EUR/USD pair appears to be encountering subdued momentum, as evidenced by the 14-day Relative Strength Index (RSI). The RSI, dipping below the 50 level, signals a bearish momentum and reflects a bias toward weaker market sentiment.
EUR/USD: Daily Chart