


- EUR/USD lacks any firm intraday direction and oscillates in a narrow range on Monday.
- The formation of a bearish flag pattern supports prospects for some meaningful decline.
- A sustained strength beyond the 1.0700 mark is needed to negate the negative outlook.
The EUR/USD pair struggles to gain any meaningful traction on Monday and remains confined in a narrow trading band, just above mid-1.0500s through the Asian session.
The US economic resilience keeps the door open for one more rate hike by the Federal Reserve (Fed) and remains supportive of elevated US Treasury bond yields. This, in turn, is seen acting as a tailwind for the US Dollar (USD), which, along with the European Central Bank’s (ECB) dovish outlook, continues to cap the upside for the EUR/USD pair.
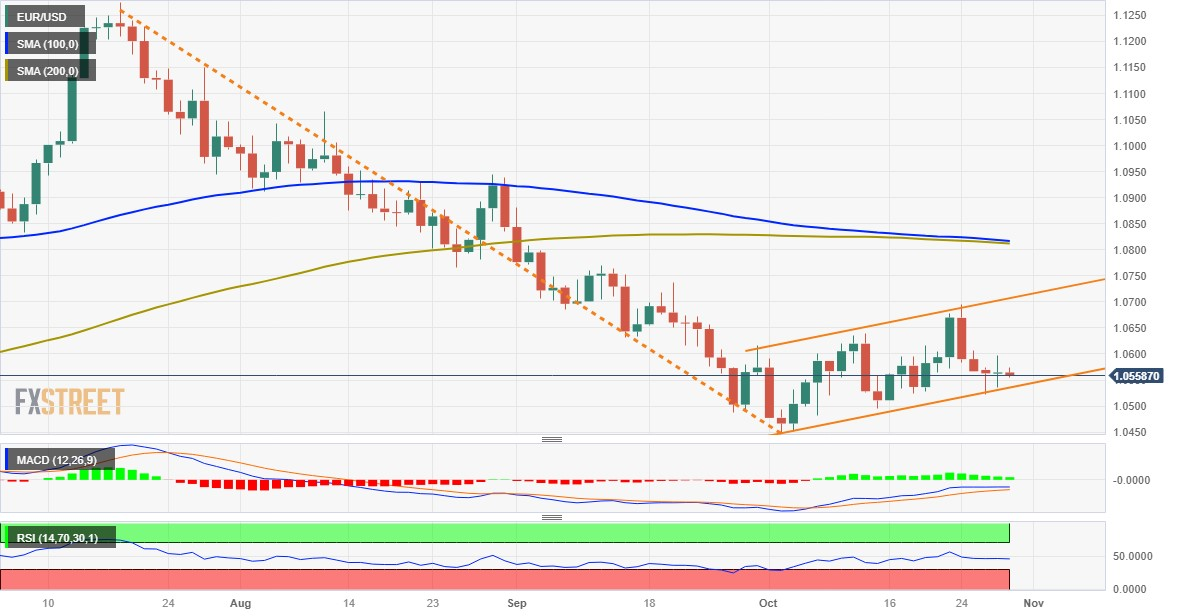
From a technical perspective, the recent recovery from the 1.0445-1.0450 region, or the YTD low, has been along an upward-sloping channel. Against the backdrop of a sharp fall from a 17-month peak touched in June, this constitutes the formation of a bearish flag pattern and suggests that the path of least resistance for the EUR/USD pair is to the downside.
Moreover, negative oscillators on the daily chart add credence to the bearish outlook. That said, it will still be prudent to wait for a convincing break below the ascending channel support, around the 1.0540-1.0535 region, before positioning for a slide towards the 1.0500 mark. The EUR/USD pair could eventually drop to restest the 1.0450-1.0445 area or the YTD trough.
On the flip side, Friday’s swing high, nearing the 1.0600 mark, now seems to act as an immediate hurdle. A sustained strength beyond has the potential to lift the EUR/USD pair towards the 1.0665-1.0670 intermediate resistance en route to the top end of the aforementioned trend channel, currently pegged just ahead of the 1.0700 round-figure mark.
The latter should act as a key pivotal point for short-term traders, which if cleared decisively will negate the bearish flag pattern and prompt aggressive short-covering move. The EUR/USD pair then aim to surpass the 1.0800 mark and challenge the 1.0810-1.0815 confluence, comprising the 100-day and the 200-day Simple Moving Averages (SMAs).
EUR/USD daily chart
Technical levels to watch


