








Gold Price Tests $5,000 After FOMC Minutes Show Divided Fed
February 19, 2026 – Live Market Update
Gold prices are testing the psychological $5,000 per ounce level today following the release of the Federal Open Market Committee (FOMC) minutes from the January meeting, which revealed a deeply divided central bank regarding the future path of interest rates .
As of mid-day trading, spot gold climbed back above $5,000 after opening near $4,880 and reaching a high of $5,011. This bounce follows a sharp selloff that saw gold fall more than 2% in the previous session .
Traders are now digesting the minutes for clues on whether the Fed will cut rates this year or potentially raise them again if inflation remains stubborn .
FOMC MINUTES VISUAL
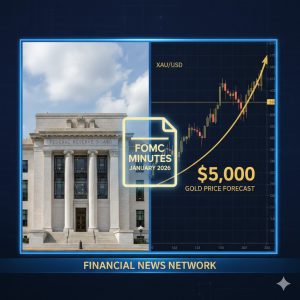
What the FOMC Minutes Revealed
The minutes from the January 28-29 Federal Reserve meeting, released today, show that officials were nearly unanimous in their decision to hold interest rates steady at 3.50% to 3.75% .
However, the outlook revealed sharp divisions:
The Hawkish Camp: Several policymakers warned that rates could rise again if inflation stays persistently high. They expressed concern that progress on inflation might stall .
The Dovish Camp: Others debated whether and when further rate cuts might be needed, particularly if economic activity slows more than expected.
Fed Staff Outlook: The staff upgraded their economic forecast, projecting stronger economic activity and slightly higher inflation than previously expected. Unemployment is expected to decline gradually starting in 2026.
Market Reaction: Markets currently price roughly 92% odds of rates holding steady at 3.50% to 3.75% in March, with the first rate cut now expected in June.
Why Gold Is Testing $5,000
Gold’s bounce back to the $5,000 level reflects several factors:
1. Technical Bounce. After falling more than 2% on Tuesday, gold found support near $4,850, triggering dip-buying from traders viewing sub-$5,000 as a discount opportunity .
2. Divided Fed Outlook. The minutes confirmed that the Fed is not united on rate cuts. This uncertainty reduces the dollar’s upside potential, supporting gold .
3. Mixed Economic Data. Recent US data has been contradictory. January CPI cooled to a four-year low of 2.4%, supporting rate cut arguments. But labor market strength (312K jobs added in January) gives the Fed room to hold rates steady.
4. Geopolitical Crosscurrents. Progress in US-Iran nuclear talks has unwound some safe-haven premium, but Ukraine-Russia peace talks remain unresolved. This two-way flow creates volatility.
FED OFFICIALS SPLIT

What Fed Officials Are Saying
Fed Governor Michael Barr (Hawkish): “Rates should remain steady for some time until officials see more evidence that inflation is heading toward the central bank’s 2% goal.” Another rate cut could come “somewhere well down the road” considering ongoing risks to the inflation outlook.
Chicago Fed President Austan Goolsbee (Dovish): There is potential for “several more” rate cuts this year if inflation continues its path toward the 2% target.
Market Implication: The market is caught between these conflicting signals, creating the perfect environment for gold to remain volatile around key levels like $5,000.
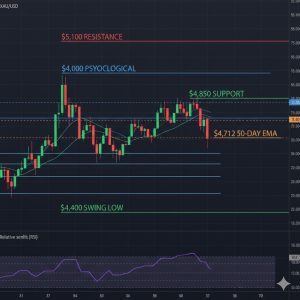
Technical Analysis: The $5,000 Battleground
Gold has been trading in an unusually choppy pattern since its violent reversal from the all-time high above $5,595 in late January .
Key Technical Levels:
| Level | Type | Significance |
|---|---|---|
| $5,100 | Resistance | Sustained close above would signal correction ending |
| $5,011 | Today’s High | Current intraday resistance |
| $5,000 | Psychological | Key battleground level |
| $4,950-4,930 | Support Zone | Recent consolidation area |
| $4,850 | Support | Tuesday’s low, major support |
| $4,712 | 50-day EMA | Rising support, broader uptrend intact |
| $4,400 | Swing Low | Early February low |
| $5,300 | Upside Target | Above $5,100 breakout |
| $5,595 | All-time High | January 2026 record |
Technical Indicators:
-
50-day EMA: Rising at $4,712 – well below current price, confirming uptrend
-
200-day EMA: Rising at $4,015 – long-term bullish structure
-
Stochastic Oscillator: Neutral near midline – momentum balanced
Analyst View: “Repeated tests of $5,000 from below point to a market searching for conviction.”
Matt Simpson, StoneX: “I expect rallies to remain capped and bulls to support selloffs, which should keep gold ranging between $4,700-$5,100 over the near term.”
TECHNICAL LEVELS CHART
The PCE Report: Friday’s Key Catalyst
While today’s FOMC minutes are driving price action, all eyes are already turning to Friday’s Personal Consumption Expenditure (PCE) report – the Fed’s preferred inflation gauge.
Why PCE Matters:
-
It’s the Fed’s preferred inflation measure
-
January’s CPI already cooled to 2.4%, supporting rate cut hopes
-
Soft PCE reading could pull forward rate-cut expectations to June
-
Q4 GDP revision also due Friday, completing a data-heavy week
Market Pricing:
-
March rate cut odds: 8% (rates expected to hold)
-
June rate cut odds: Increasingly likely as first cut timing
-
Total 2026 cuts: Market pricing two to three cuts this year
ANZ Bank Outlook: The bank recently raised its gold Q2 target from $5,400 to $5,800, noting that “gold as the ultimate insurance asset is becoming increasingly attractive” amid Fed rate cut expectations, tariff uncertainties, and global debt pressures .
How to Trade Gold Around Current Levels
For today’s session, three approaches make sense:
Strategy 1: Range Trading
With gold ranging between $4,850 and $5,100, traders can buy near support and sell near resistance. Current price near $5,000 offers limited risk-reward either way until a clear breakout occurs.
Strategy 2: Breakout Play
If gold closes above $5,100 with strong volume, it will signal the corrective phase is ending and open the path toward $5,300 and the January high. Entry above $5,100, stop below $5,050.
Strategy 3: Support Bounce
If gold pulls back to $4,850 and holds, this is a high probability buy zone with stop below $4,800.
Risk Warning: “Short-term volatility usually increases around data releases. Tight stop losses and position sizing according to risk profile are recommended.”
What Professional Analysts Are Saying
Ajay Kedia, Kedia Commodities:
“Gold prices are taking support above $4,850 today… this is a technical bounce after prices fell in the previous session on easing geopolitical tensions.”
BMO Capital Markets Analysts:
Throughout the Lunar New Year holiday period, investors “can reasonably expect a soft patch” for precious metals, opening a window for dip buying .
RoboForex Analysis:
“XAUUSD prices retain the potential for further upside and may head towards the next psychological level of 6,000 USD in the near term.”
The Bigger Picture: 2026 Gold Drivers
Several structural factors continue supporting gold:
1. Central Bank Demand. The People’s Bank of China extended gold purchases for a fifteenth straight month in January. Central banks from emerging economies continue diversifying reserves .
2. Geopolitical Uncertainty. While US-Iran talks have progressed, Ukraine-Russia negotiations remain unresolved. Safe-haven demand persists.
3. Fed Policy Uncertainty. With divided policymakers and conflicting economic data, rate path uncertainty favors gold as a hedge.
4. Thin Liquidity Conditions. Chinese markets remain closed for Lunar New Year until February 23, creating conditions for amplified volatility.
CENTRAL BANK GOLD DEMAND

Summary: Gold at the Crossroads
Gold’s test of $5,000 following today’s FOMC minutes reflects a market caught between competing forces:
-
Hawkish Fed warnings vs dovish rate cut expectations
-
Geopolitical progress vs ongoing uncertainty
-
Technical support vs resistance levels
The Next 48 Hours Will Be Critical:
-
Thursday: Potential reaction to Fed speakers and jobless claims
-
Friday: PCE inflation report and Q4 GDP revision
Bullish Scenario: Soft PCE data confirms disinflation trend → Rate cut expectations solidify → Dollar weakens → Gold breaks $5,100 → Next target $5,300
Bearish Scenario: Sticky PCE data surprises → Rate cut hopes delayed → Dollar strengthens → Gold re-tests $4,850 → Potential move toward $4,712 support
For now, the smartest position is patience. Let the data show its hand, then trade accordingly.