


- GBP/USD may face key resistance near the psychologically significant 1.3400 level
- The 14-day RSI has crossed above 70, indicating that a downside correction could be imminent.
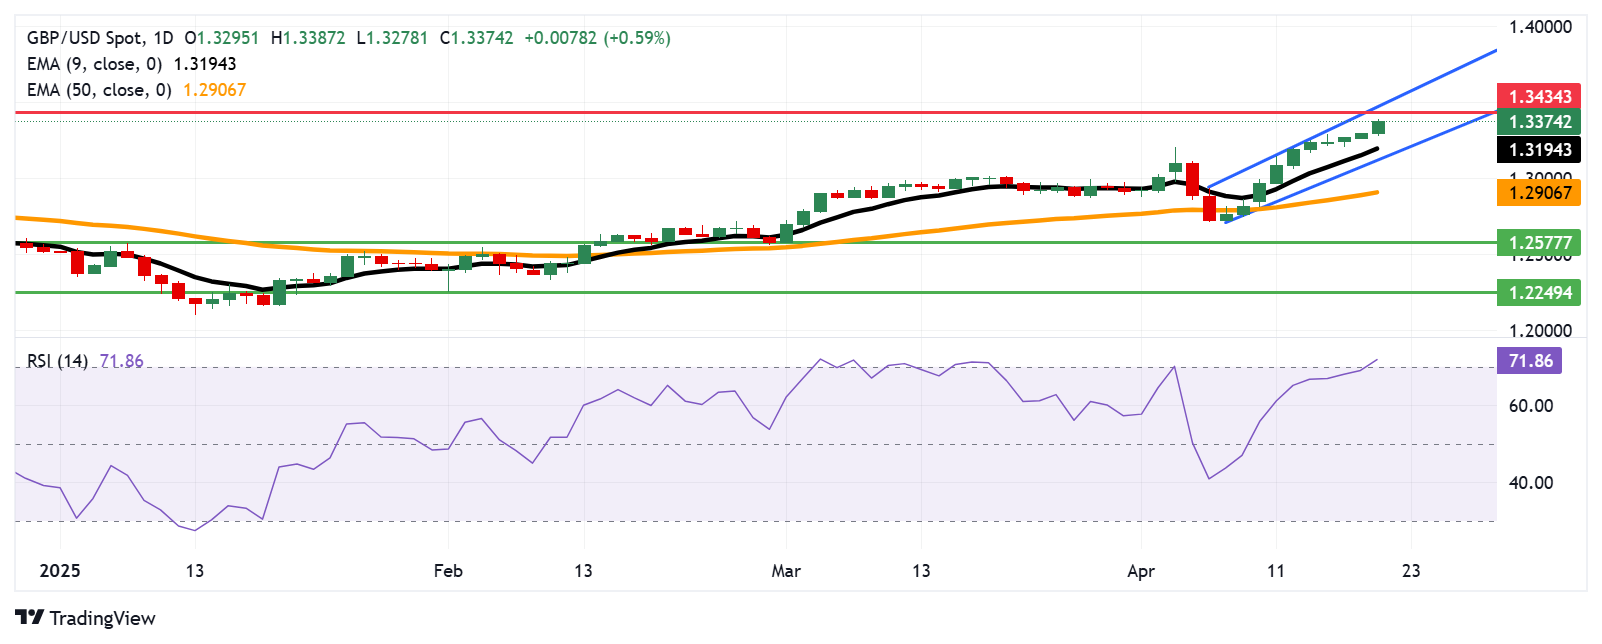
- The nearest support is at the nine-day EMA, around 1.3194, with additional support found at the lower boundary of the ascending channel near 1.3150
GBP/USD Extends Winning Streak, Trades Near 1.3370
The GBP/USD pair continues its upward momentum that began on April 8, currently hovering around 1.3370 during Monday’s Asian session. Technical indicators on the daily chart suggest that the bullish trend remains intact, with the pair moving within a well-defined ascending channel.
Technical Indicators Support Bullish Outlook, But RSI Signals Caution
The pair is trading above the nine-day Exponential Moving Average (EMA), underscoring short-term bullish momentum. However, the 14-day Relative Strength Index (RSI) has risen above the 70 mark, signaling overbought conditions and raising the risk of a short-term pullback
Key Resistance Levels: 1.3400 and 1.3434
GBP/USD faces initial resistance at the key psychological level of 1.3400. A break above this level may lead to a test of 1.3434, a price last observed in September 2024. If the bullish trend continues, the pair could aim for the upper boundary of the ascending channel near 1.3480.
Support Levels to Watch: 1.3194 and Below
On the downside, immediate support lies at the nine-day EMA around 1.3194, followed by the ascending channel’s lower boundary near 1.3150. A break below this range could challenge the short-term bullish narrative, with the 50-day EMA at 1.2906 serving as the next significant level.
Deeper Correction Could Shift Medium-Term Bias
Should the pair fall below the 50-day EMA, the medium-term bullish outlook could weaken. Further downside targets include the two-month low of 1.2577 from March 3 and the three-month low of 1.2249, recorded on February 3.
GBP/USD Daily Chart Overview
British Pound Today: Latest Price Movements
The table below shows the percentage change of British Pound (GBP) against listed major currencies today. British Pound was the strongest against the US Dollar.
| USD | EUR | GBP | JPY | CAD | AUD | NZD | CHF | |
|---|---|---|---|---|---|---|---|---|
| USD | -1.03% | -0.63% | -0.86% | -0.36% | -0.51% | -1.04% | -0.96% | |
| EUR | 1.03% | 0.25% | 0.15% | 0.63% | 0.33% | -0.04% | 0.05% | |
| GBP | 0.63% | -0.25% | 0.08% | 0.40% | 0.08% | -0.29% | -0.20% | |
| JPY | 0.86% | -0.15% | -0.08% | 0.50% | 0.21% | -0.07% | -0.07% | |
| CAD | 0.36% | -0.63% | -0.40% | -0.50% | -0.27% | -0.68% | -0.58% | |
| AUD | 0.51% | -0.33% | -0.08% | -0.21% | 0.27% | -0.36% | -0.28% | |
| NZD | 1.04% | 0.04% | 0.29% | 0.07% | 0.68% | 0.36% | 0.12% | |
| CHF | 0.96% | -0.05% | 0.20% | 0.07% | 0.58% | 0.28% | -0.12% |


