- EUR/USD could reach immediate resistance around the major level at 1.0950.
- Technical indicators suggest a stronger momentum; bulls could target August’s high at 1.1064.
- A firm break below 1.0900 could inspire the bears to navigate the nine-day EMA.
EUR/USD continues the winning streak, trading around a three-month high at 1.0920 during the Asian session on Monday. The pair seems to approach immediate resistance around the major level at 1.0950 as the US Dollar (USD) faces pressure on the likelihood of the Federal Reserve (Fed) to conclude its interest rate-hike cycle.
A breakthrough above the latter could support the bulls of the EUR/USD pair to target the next barrier at the 1.1000 psychological level, following August’s high at 1.1064.
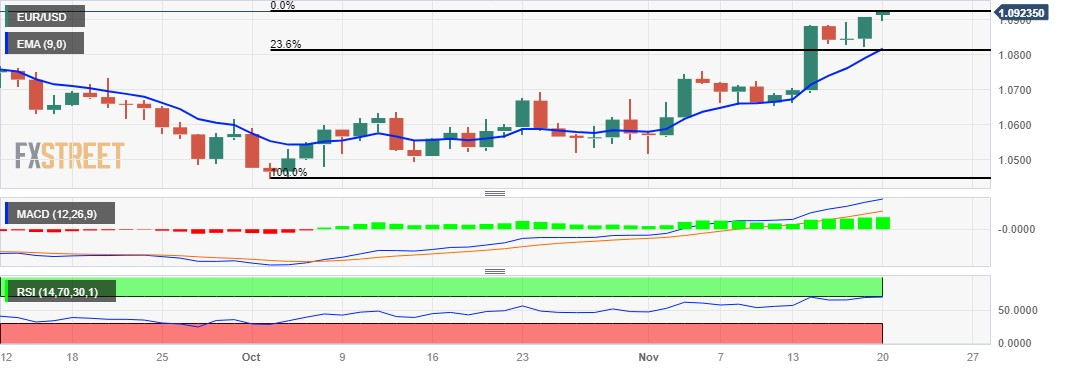
The ongoing upward trend is backed by the technical indicators for the EUR/USD pair. The 14-day Relative Strength Index (RSI) above the 50 level signals bullish sentiment, indicating a stronger momentum for the pair.
Additionally, the Moving Average Convergence Divergence (MACD) line lies above the centerline, with divergence above the signal line, suggesting a bullish momentum in the EUR/USD pair.
On the downside, the psychological level at 1.0900 emerges as a key support, following the next major level at 1.0850. A firm break below the level could put pressure on the EUR/USD pair to navigate the region around the nine-day Exponential Moving Average (EMA) at 1.0819, aligning with the 23.6% Fibonacci retracement at 1.0811.
EUR/USD: Daily Chart