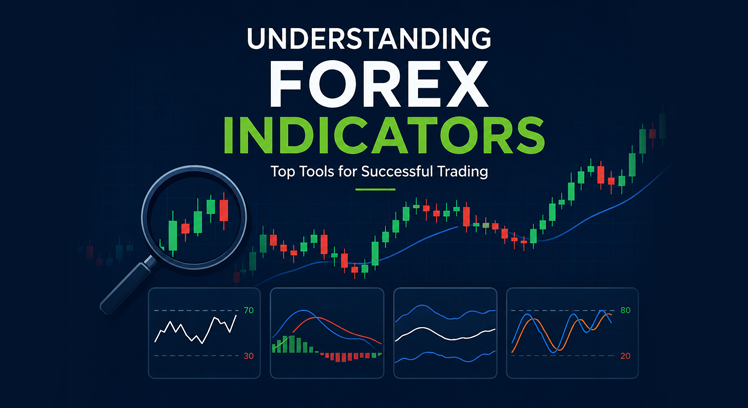
Success in the Forex market is not based on luck or guesswork. Professional traders rely on technical analysis and well-tested trading strategies to identify market opportunities. One of the most important components of technical analysis is the use of Forex indicators.
Forex indicators are mathematical calculations based on historical price, volume, or market data. They help traders analyze market trends, identify potential entry and exit points, measure momentum, and manage trading risks. While indicators cannot predict the future with certainty, they significantly improve decision-making when combined with sound risk management and market knowledge.
This guide explains what Forex indicators are, how they work, the most popular indicators used by professional traders, and how to avoid common mistakes when using them.
What Are Forex Indicators?
Forex indicators are analytical tools used within trading platforms to evaluate currency price movements. They process historical market data and display visual signals that help traders understand the current market condition.
Indicators are commonly used to:
- Identify market trends
- Detect momentum
- Measure market volatility
- Find support and resistance levels
- Generate buy and sell signals
- Confirm trading decisions
Most trading platforms, including MetaTrader 4 (MT4), MetaTrader 5 (MT5), TradingView, and cTrader, include dozens of built-in indicators.
It is important to understand that indicators are decision-support tools, not automatic profit generators. They work best when combined with price action analysis, proper risk management, and a well-defined trading plan.
Types of Forex Indicators
Forex indicators generally fall into four major categories.
1. Trend Indicators
Trend indicators help determine the overall direction of the market.
They answer questions such as:
- Is the market moving upward?
- Is the market moving downward?
- Is the market ranging?
Examples include:
- Moving Average (MA)
- Exponential Moving Average (EMA)
- MACD
- Parabolic SAR
These indicators are especially useful in trending markets.
2. Momentum Indicators
Momentum indicators measure the speed and strength of price movement.
They help traders determine whether buyers or sellers currently dominate the market.
Popular momentum indicators include:
- Relative Strength Index (RSI)
- Stochastic Oscillator
- Commodity Channel Index (CCI)
Momentum indicators often identify overbought and oversold market conditions.
3. Volatility Indicators
Volatility indicators measure how much price fluctuates over time.
Higher volatility generally means larger price movements, while lower volatility indicates quieter market conditions.
Examples include:
- Bollinger Bands
- Average True Range (ATR)
These indicators help traders determine stop-loss placement and position sizing.
4. Volume Indicators
Although the Forex market does not have centralized volume data, brokers provide tick volume that helps estimate trading activity.
Common volume-based indicators include:
- On Balance Volume (OBV)
- Volume Oscillator
- Money Flow Index (MFI)
Volume indicators are often used to confirm trend strength.
Why Forex Indicators Matter
Indicators simplify complex market information into easy-to-read signals.
Benefits include:
- Reducing emotional decision-making
- Identifying high-probability trade setups
- Improving trade timing
- Confirming trend direction
- Supporting risk management
- Increasing consistency in trading
However, no indicator guarantees profitable trades.
Successful traders use indicators as confirmation rather than relying on them exclusively.
Top Forex Indicators for Traders
Below are the most widely used Forex indicators by beginners and professional traders.
1. Moving Average (MA)
The Moving Average is one of the simplest and most popular trend indicators.
It smooths price fluctuations by calculating the average closing price over a selected period.
Types
- Simple Moving Average (SMA)
- Exponential Moving Average (EMA)
Best Uses
- Identify market trends
- Dynamic support and resistance
- Trend-following strategies
Advantages
- Easy to understand
- Filters market noise
- Excellent for beginners
Limitations
- Generates delayed signals
- Less effective during sideways markets
2. Relative Strength Index (RSI)
The RSI measures momentum on a scale from 0 to 100.
Generally:
- Above 70 = Overbought
- Below 30 = Oversold
Best Uses
- Spot potential reversals
- Identify momentum shifts
- Confirm trend strength
Advantages
- Easy interpretation
- Excellent for ranging markets
Limitations
- Can remain overbought or oversold during strong trends
3. Moving Average Convergence Divergence (MACD)
MACD combines trend-following and momentum analysis.
It consists of:
- MACD Line
- Signal Line
- Histogram
Best Uses
- Trend confirmation
- Momentum analysis
- Bullish and bearish crossovers
Advantages
- Combines multiple market factors
- Widely trusted by professional traders
Limitations
- May lag during fast-moving markets
4. Bollinger Bands
Bollinger Bands consist of:
- Upper Band
- Middle Moving Average
- Lower Band
The bands expand during high volatility and contract during low volatility.
Best Uses
- Volatility analysis
- Breakout identification
- Mean reversion strategies
Advantages
- Excellent visual representation
- Helps identify potential reversals
Limitations
- Should not be used alone
5. Stochastic Oscillator
The Stochastic Oscillator compares the latest closing price to the recent trading range.
Values range between 0 and 100.
Best Uses
- Overbought and oversold analysis
- Reversal trading
- Range-bound markets
Advantages
- Fast signals
- Good for swing traders
Limitations
- Produces false signals during strong trends
6. Average True Range (ATR)
ATR measures market volatility instead of trend direction.
Higher ATR values indicate larger price movement.
Best Uses
- Stop-loss placement
- Position sizing
- Measuring market activity
Advantages
- Improves risk management
- Useful in every market condition
Limitations
- Does not indicate market direction
7. Fibonacci Retracement
Although technically a drawing tool rather than a traditional indicator, Fibonacci Retracement is widely used in Forex trading.
Common retracement levels include:
- 23.6%
- 38.2%
- 50%
- 61.8%
- 78.6%
Best Uses
- Finding pullback entries
- Support and resistance
- Trend continuation
Advantages
- Highly respected among traders
- Works well with price action
Limitations
- Subjective placement
8. Ichimoku Cloud
Ichimoku Cloud is an all-in-one trading system that provides:
- Trend direction
- Support and resistance
- Momentum
- Entry signals
Best Uses
- Trend trading
- Long-term analysis
Advantages
- Comprehensive market overview
Limitations
- Complex for beginners
How to Combine Forex Indicators
Professional traders rarely depend on a single indicator.
Instead, they combine indicators that complement each other.
Example combinations include:
Trend + Momentum
- EMA + RSI
Purpose:
Trade only in the direction of the trend while using RSI for timing entries.
Trend + Volatility
- Moving Average + Bollinger Bands
Purpose:
Confirm trend while identifying breakout opportunities.
Momentum + Volatility
- MACD + ATR
Purpose:
Confirm momentum before entering trades with appropriate stop-loss placement.
How to Choose the Right Forex Indicators
There is no universal “best” indicator.
The ideal indicator depends on your trading style.
For Scalpers
Recommended:
- EMA
- RSI
- ATR
Reason:
Quick entries and fast market analysis.
For Day Traders
Recommended:
- MACD
- Bollinger Bands
- RSI
Reason:
Multiple intraday opportunities.
For Swing Traders
Recommended:
- Fibonacci Retracement
- Moving Average
- MACD
Reason:
Capture larger market movements.
For Position Traders
Recommended:
- Ichimoku Cloud
- Long-term Moving Averages
Reason:
Analyze broader market trends.
Common Mistakes to Avoid with Forex Indicators
Many traders misuse indicators, leading to poor trading decisions.
1. Using Too Many Indicators
Adding five or six indicators to one chart creates confusion.
Instead, use only two or three complementary indicators.
2. Ignoring Price Action
Indicators are based on historical prices.
Always analyze candlestick patterns and market structure before making decisions.
3. Blindly Following Signals
No indicator is accurate 100% of the time.
Always seek confirmation from multiple sources.
4. Using the Same Settings for Every Market
Default indicator settings do not work equally well across all currency pairs and timeframes.
Optimize settings through testing.
5. Ignoring Risk Management
Even the best indicator cannot prevent losses.
Always use:
- Stop-loss orders
- Proper position sizing
- Realistic risk-to-reward ratios
6. Chasing Every Signal
Not every signal deserves a trade.
Professional traders wait patiently for high-quality setups.
Best Practices for Using Forex Indicators
To improve trading performance:
- Develop a written trading plan.
- Combine indicators with price action analysis.
- Test strategies on a demo account before trading live.
- Review your trading journal regularly.
- Focus on consistency rather than frequent trades.
- Avoid emotional trading.
- Keep learning and adapting to changing market conditions.
Final Thoughts
Forex indicators are powerful analytical tools that help traders understand market behavior, identify trends, and improve decision-making. However, they should never be viewed as guaranteed profit generators.
The most successful traders understand that indicators work best as part of a complete trading strategy that includes technical analysis, disciplined risk management, and emotional control.
Whether you are a beginner learning your first Moving Average or an experienced trader refining a multi-indicator strategy, mastering Forex indicators takes practice, patience, and continuous education. By understanding how each indicator works and applying them wisely, you can make more informed trading decisions and build a stronger foundation for long-term success in the Forex market.
Frequently Asked Questions (FAQs)
1. What is the most accurate Forex indicator?
There is no single most accurate indicator. Many traders combine the Moving Average, RSI, and MACD for better confirmation and more reliable trading decisions.
2. Can Forex indicators predict the market?
No. Indicators analyze historical price data to estimate potential future movements. They improve probability but cannot predict the market with certainty.
3. How many indicators should I use on one chart?
Most experienced traders recommend using two to four complementary indicators. Using too many can create conflicting signals and make analysis more difficult.
4. Are Forex indicators suitable for beginners?
Yes. Beginner-friendly indicators such as the Moving Average, RSI, and Bollinger Bands are widely used because they are easy to understand and interpret.
5. Should I rely only on indicators when trading?
No. Indicators should be used alongside price action, support and resistance levels, market fundamentals, and proper risk management for more effective trading decisions.