


- USD/CHF could test immediate resistance near the upper limit of its current consolidation range at approximately 0.8350.
- The 14-day RSI has risen above the 30 level, indicating a sustained short-term recovery in price action.
- A dip below the crucial support at the nine-day EMA, currently at 0.8251, may dampen the pair’s short-term momentum.
USD/CHF Steady Near 0.8270 in Asian Trading
The USD/CHF pair is holding firm for the third consecutive session, hovering around the 0.8270 mark during Thursday’s Asian trading hours. On the daily chart, the pair continues to move sideways within a defined rectangular consolidation pattern, suggesting a neutral stance in the market.
Technical Indicators Signal Limited Momentum
USD/CHF is trading close to its nine-day Exponential Moving Average (EMA), pointing to a lack of clear short-term direction. Meanwhile, the 14-day Relative Strength Index (RSI) has climbed above 30, hinting at a mild corrective rebound. However, with the RSI still below the 50 level, broader bearish sentiment persists.
Resistance Levels to Watch
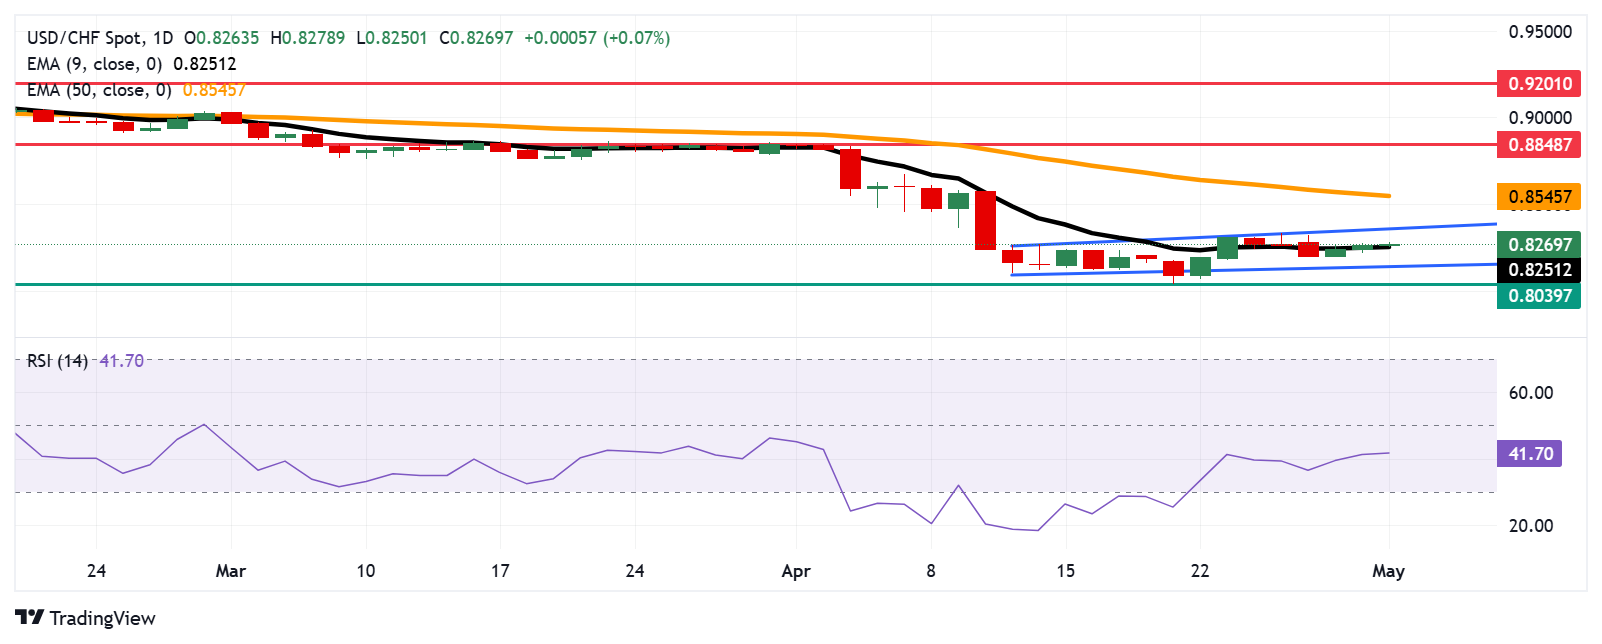
On the upside, the immediate resistance is located near 0.8350, the upper boundary of the current consolidation range. A decisive break above this level may trigger bullish momentum, potentially driving the pair toward the 50-day EMA, currently positioned at 0.8545. A further rally could target the monthly high of 0.8848, last recorded on April 2.
Support Levels and Downside Risks
Initial support lies at the nine-day EMA, around 0.8251. A drop below this mark could weaken short-term momentum, increasing the risk of a decline toward the rectangle’s lower limit at 0.8140. Continued selling pressure might lead to a deeper fall toward 0.8039 — the lowest level observed since November 2011, reached on April 21.
USD/CHF: Daily Chart
Swiss Franc PRICE Today
The table below illustrates the daily percentage change of the Swiss Franc (CHF) relative to major currencies. On this occasion, the Swiss Franc has shown the most significant decline against the New Zealand Dollar.
| USD | EUR | GBP | JPY | CAD | AUD | NZD | CHF | |
|---|---|---|---|---|---|---|---|---|
| USD | 0.16% | 0.22% | 0.52% | -0.02% | -0.01% | -0.15% | 0.10% | |
| EUR | -0.16% | 0.07% | 0.36% | -0.22% | -0.17% | -0.31% | -0.07% | |
| GBP | -0.22% | -0.07% | 0.27% | -0.26% | -0.24% | -0.38% | -0.17% | |
| JPY | -0.52% | -0.36% | -0.27% | -0.56% | -0.52% | -0.72% | -0.51% | |
| CAD | 0.02% | 0.22% | 0.26% | 0.56% | 0.03% | -0.13% | 0.10% | |
| AUD | 0.00% | 0.17% | 0.24% | 0.52% | -0.03% | -0.14% | 0.08% | |
| NZD | 0.15% | 0.31% | 0.38% | 0.72% | 0.13% | 0.14% | 0.22% | |
| CHF | -0.10% | 0.07% | 0.17% | 0.51% | -0.10% | -0.08% | -0.22% |