

Intraday trading in the EUR/USD currency pair requires a comprehensive understanding of current market trends, key technical levels, and effective risk management strategies. This article provides an in-depth analysis of the EUR/USD pair as of March 27, 2025, highlighting crucial support and resistance levels, potential entry and exit points, and both fundamental and technical insights to guide your trading decisions.
Overview of EUR/USD
As of March 27, 2025, the EUR/USD pair has exhibited notable volatility, influenced by various economic indicators and geopolitical events. Recent data releases, including Eurozone inflation figures and U.S. Non-Farm Payrolls, have significantly impacted the pair’s movement. Additionally, geopolitical tensions, such as trade policies and international conflicts, continue to contribute to market uncertainty.
Key Technical Levels for Intraday Trading of EUR/USD
Identifying critical support and resistance levels is essential for intraday trading. The following levels are pertinent as of the current market scenario:
-
Support Levels:
-
1.0352: This level corresponds to the 2016 swing low and serves as initial weekly support.
-
1.0210: Observed as a significant low during early February 2025, marking a potential area for price stabilization.
-
-
Resistance Levels:
-
1.0420: Identified as a recent high in late February 2025, acting as a short-term resistance point.
-
1.0530: Approached during mid-February 2025, this level represents a higher resistance threshold.
-
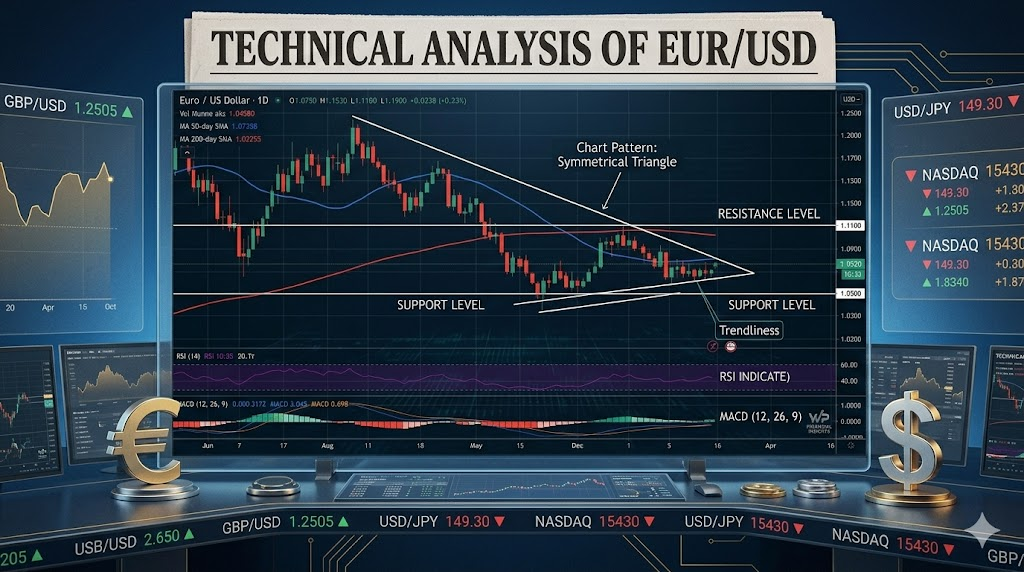
Technical Indicators and Analysis for EUR/USD
Utilizing technical indicators can enhance the precision of entry and exit points:
-
Relative Strength Index (RSI): An RSI value approaching or exceeding 70 suggests overbought conditions, indicating a potential sell opportunity. Conversely, an RSI near or below 30 indicates oversold conditions, suggesting a potential buy opportunity.
-
Moving Averages: The 100-period Simple Moving Average (SMA) on a 4-hour chart has been observed as a dynamic support level. A price action above this SMA may indicate bullish momentum, while trading below it could suggest bearish tendencies.
Intraday Trading Strategy for EUR/USD Trading in Asia
Given the current market conditions, a Mean Reversion Strategy can be effective:
-
Identify Key Levels: Monitor the aforementioned support and resistance levels for potential price reversals.
-
Confirm with RSI: Look for RSI values indicating overbought or oversold conditions near these key levels.
-
Enter Position:
-
Buy: If the price approaches a support level with an RSI below 30, consider entering a long position.
-
Sell: If the price nears a resistance level with an RSI above 70, consider entering a short position.
-
-
Set Stop-Loss Orders: Place stop-loss orders just beyond the identified support or resistance levels to mitigate potential losses.
-
Determine Exit Points: Aim to exit the trade as the price approaches the opposite key level or when the RSI returns to neutral territory (between 40 and 60).
Risk Management in Forex Trading
Effective risk management is crucial:
-
Position Sizing: Limit risk to a small percentage (e.g., 1-2%) of your trading capital per trade.
-
Stop-Loss Orders: Implement stop-loss orders to protect against significant losses by setting predefined exit levels.
-
Stay Informed: Keep abreast of economic news releases and geopolitical events that may impact currency movements.
Conclusion
Intraday trading of the EUR/USD pair demands a thorough analysis of technical levels, market trends, and disciplined risk management. By identifying key support and resistance levels, utilizing technical indicators like RSI and moving averages, and adhering to a well-defined trading strategy, traders can enhance their decision-making process. Always remain vigilant of market developments and adjust strategies accordingly to navigate the dynamic forex trading landscape effectively.