- USD/MXN struggles to gain any meaningful traction, though the bias remains tilted in favour of bulls.
- Any further slide could attract fresh buyers near the 17.80 confluence breakpoint, now turned support.
- A convincing break below the 23.6% Fibo. level is needed to negate the near-term constructive outlook.
The USD/MXN pair is seen oscillating in a narrow trading band during the Asian session on Wednesday and consolidating the overnight heavy losses to a multi-day low. Spot prices currently trade around the 17.95-17.90 region, nearly unchanged for the day, though any meaningful downside still seems elusive.
Against the backdrop of the recent failure to find acceptance above the 38.2% Fibonacci retracement level of the fall witnessed in July, the prevalent US Dollar (USD) selling bias is seen as a key factor acting as a headwind for the USD/MXN pair. Subsequent decline, however, is more likely to find decent support around the 17.80-17.85 confluence, comprising a technically significant 200-day Simple Moving Average (SMA) and a multi-month-old descending trend-line.
Moreover, oscillators on the daily chart – though have been retreating from higher levels – are still holding in the bullish territory and support prospects for the emergence of some dip-buying near the aforementioned resistance-turned-support. Some follow-through selling, however, could make the USD/MXN pair to accelerate the fall to the 17.40-17.35 horizontal support. Spot prices might then weaken further below the 17.15-17.10 region, towards testing sub-17.00 levels.
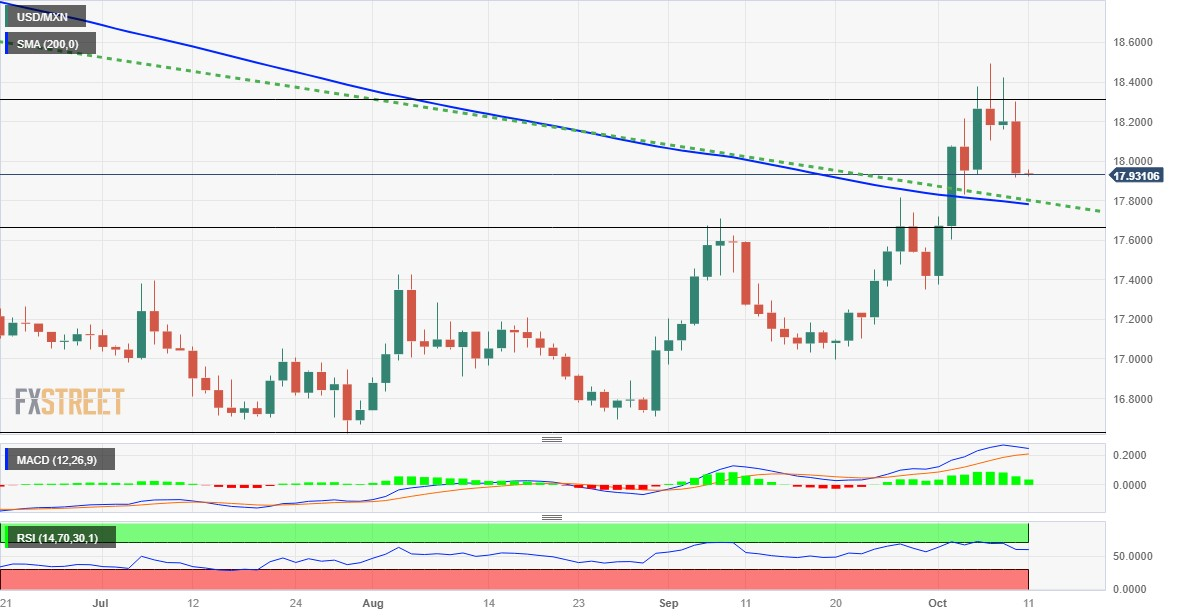
On the flip side, momentum back above the 18.00 round figure might now confront some resistance around the 18.15-18.20 zone. This is followed by 38.2% Fibo., around the 18.30 region and mid-18.00s, or the highest level since late March touched last week. A sustained strength beyond will set the stage for the resumption of the recent appreciating move witnessed over the past month or so and lift the USD/MXN pair to the 18.80-18.85 area, representing 50% Fibo. level.
USD/MXN daily chart