- USD/MXN lacks any firm intraday direction on Tuesday and remains confined in a narrow range.
- The technical setup favours bulls and supports prospects for an extension of a one-month-old uptrend.
- A convincing break below the 23.6% Fibo. level is needed to negate the near-term positive outlook.
The USD/MXN pair struggles to gain any meaningful traction on Tuesday and oscillates in a narrow trading range, around the 18.20 region through the Asian session.
From a technical perspective, spot prices have been struggling to find acceptance above the 38.2% Fibonacci retracement level of the steep fall witnessed in July. This, along with the fact that the Relative Strength Index (RSI) on the daily chart is still holding in the overbought territory, warrants caution for bullish traders. That said, the recent breakout through the 17.80-17.85 confluence, comprising a technically significant 200-day Simple Moving Average (SMA) and a multi-month-old descending trend-line, suggests that the path of least resistance for the USD/MXN pair is to the upside.
In the meantime, any corrective decline is more likely to attract fresh buyers near the 18.0000 mark and remain limited near the aforementioned resistance breakpoint, now turned support. The next relevant support is pegged near the 23.6% Fibo. level, around the 17.6635 area, which if broken decisively will negate the positive outlook and shift the near-term bias back in favour of bearish traders. The USD/MXN pair might then accelerate the slide further towards the 17.40-17.35 horizontal support en route to the 17.15-17.10 region before eventually dropping to test sub-17.00 levels.
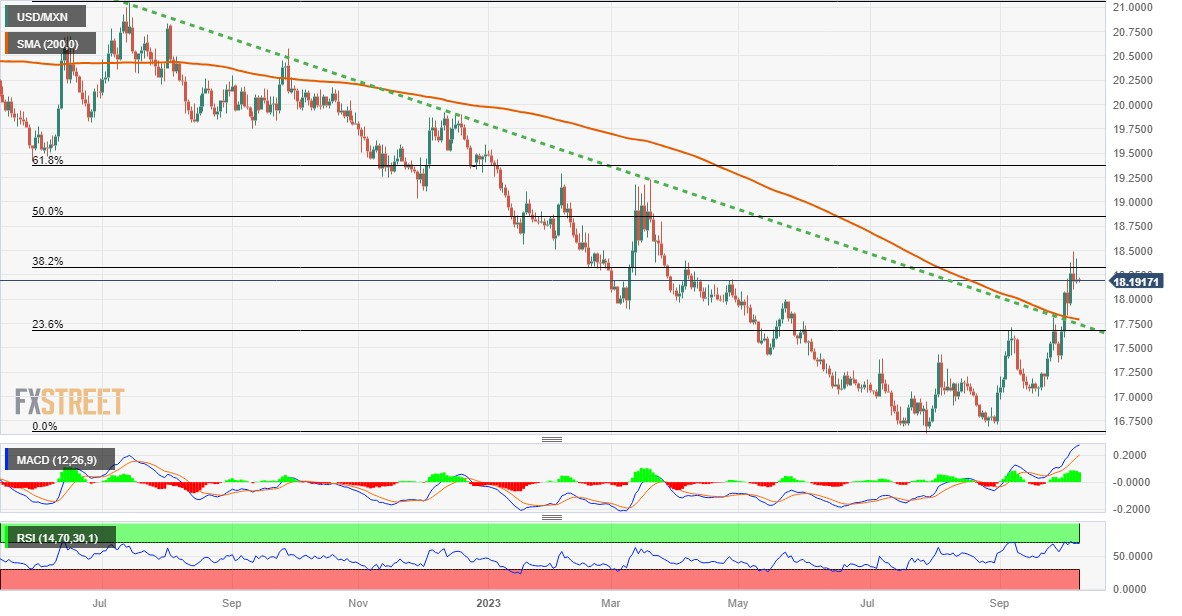
On the flip side, bulls need to wait for a sustained strength beyond the 38.2% Fibo. level before placing fresh bets. Some follow-through buying above Friday’s swing high, around the mid-18.00s will reaffirm the positive bias and lift the USD/MXN pair further to the 18.80-18.85 area, representing 50% Fibo. level. Some follow-through buying should pave the way for an extension of the recent appreciating move witnessed over the past month or so.
USD/MXN daily chart