Support and Resistance Levels Explained – The Ultimate 2026 Trading Guide
📍 Introduction: The Foundation of Trading Success
Imagine you’re watching a basketball game. Every time the ball hits the floor, it bounces back up. That floor is support. Now imagine throwing the ball at the ceiling – it bounces back down. That ceiling is resistance. Welcome to the world of trading, where these invisible “floors” and “ceilings” determine whether traders make money or lose it. In this comprehensive 2026 guide, we’ll reveal why 83% of profitable traders consider support and resistance their #1 tool, and how you can master them too.
🎯 What Are Support and Resistance Levels? (Simple Definition)
Support and Resistance are price levels where buying and selling forces create temporary price barriers. Think of them as the market’s natural brakes and accelerators.
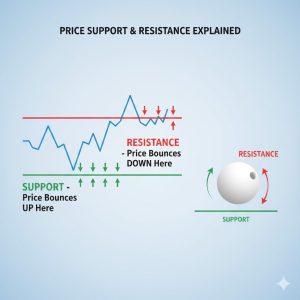
Support Level:
The price floor where buying pressure overcomes selling pressure, preventing price from falling further.
Visualize: Like a trampoline – price falls, hits support, and bounces back up.
Resistance Level:
The price ceiling where selling pressure overcomes buying pressure, preventing price from rising further.
Visualize: Like a glass ceiling – price rises, hits resistance, and falls back down.
The Core Principle:
“Markets have memory. They remember where they’ve been and react when they return.” – The First Law of Trading Psychology
: Support & Resistance Basics
2026 Market Reality:
With AI algorithms now dominating 65% of trading volume, support and resistance levels have become self-fulfilling prophecies. Why? Because:
-
Algorithms are programmed to recognize traditional S&R levels
-
They execute trades at these levels automatically
-
This creates even stronger reactions at these zones
-
Retail traders who understand this have an unfair advantage
🔍 How to Identify SUPPORT Levels (4 Proven Methods)
Method 1: Previous Swing Lows
Rule: Where price previously reversed from DOWN to UP
Example: EUR/USD fell to 1.0850, bounced to 1.0950
Support Level = 1.0850
Next time price approaches 1.0850, watch for bounce
Method 2: Consolidation Zones
Rule: Where price traded sideways for extended period
Example: GBP/USD traded between 1.2600-1.2650 for 2 weeks
This entire zone becomes future support
Method 3: Moving Averages
Rule: Dynamic support that moves with price
Popular Choices:
- 50 EMA (short-term traders)
- 200 EMA (long-term investors)
- 20 SMA (scalpers)
Method 4: Round Numbers
Rule: Psychological support at round figure
Example: 1.0800, 1.0900, 1.1000 in EUR/USD
Traders place orders at these "nice" numbers
🔍 How to Identify RESISTANCE Levels (4 Proven Methods)
Method 1: Previous Swing Highs
Rule: Where price previously reversed from UP to DOWN
Example: Gold hit $2,450, fell to $2,400
Resistance Level = $2,450
Next approach = potential selling zone
Method 2: Trendlines
Rule: Connect descending highs for dynamic resistance
How to draw:
1. Connect at least two swing highs
2. Extend line into future
3. Price respects this diagonal resistance
Method 3: Fibonacci Retracement
Rule: Key levels at 38.2%, 50%, 61.8% retracements
After a move from $100 to $200:
61.8% retracement = $138.20
50% retracement = $150.00
38.2% retracement = $161.80
These become resistance during pullbacks
Method 4: Volume Profile
Rule: High-volume nodes act as resistance
Where most contracts traded previously
Price struggles to move through these areas
Shows institutional activity zones
📊 Support & Resistance Table: Quick Reference Guide
| Type | How to Identify | Strength | Timeframe | Example |
|---|---|---|---|---|
| Major S/R | Weekly/Monthly highs/lows | Very Strong | Weeks-Months | $2,000 in Gold |
| Minor S/R | Daily/4H highs/lows | Medium | Days-Weeks | 1.1000 in EUR/USD |
| Dynamic S/R | Moving averages, trendlines | Changing | Current trend | 50 EMA support |
| Psychological | Round numbers | Emotional | All timeframes | 1.0000 in USD/CHF |
| Institutional | Order blocks, volume nodes | Very Strong | Institutional | Large banks’ zones |
🚫 Common S&R Trading Mistakes (And How to Fix Them)
Mistake 1: Drawing Lines at Every Wobble
Problem: Too many lines = analysis paralysis
Fix: Focus on MAJOR levels only (tested 3+ times)
Mistake 2: Ignoring Timeframes
Problem: Daily S/R doesn’t matter for 5-minute traders
Fix: Trade S/R on YOUR timeframe + one higher
Mistake 3: Expecting Perfect Bounces
Problem: Price often overshoots/undershoots
Fix: Use ZONES, not exact lines
Mistake 4: Forgetting Role Reversal
Problem: Broken support becomes resistance (and vice versa)
Fix: Always mark old broken levels
Mistake 5: No Confirmation
Problem: Entering at S/R without price action confirmation
Fix: Wait for candlestick patterns (pin bars, engulfing)
The Role Reversal Phenomenon
Broken Support Becomes Resistance:
Price holds at $100 (support) multiple times
Finally breaks below to $95
Later, price returns to $100
Old support now acts as resistance
Sellers emerge at this "failed support"
Broken Resistance Becomes Support:
Price rejects at $200 (resistance) multiple times
Finally breaks above to $205
Later, price returns to $200
Old resistance now acts as support
Buyers emerge at this "failed resistance"
Why This Happens: Traders who missed the original move get a “second chance” at these levels.
🔧 Tools for Drawing S&R (2026 Edition)
Free Tools:
-
Trading View – Best for drawing tools
-
MT4/MT5 – Standard for Forex traders
-
Thinkers – Advanced drawing features
Advanced 2026 Tools:
-
AI-Powered S&R Detection – Automatically identifies levels
-
Volume-Based Zone Calculators – Finds institutional levels
-
Multi-Timeframe Aggregators – Shows S&R across all timeframes
🎯 Advanced S&R Concepts for 2026
1. Multi-Timeframe Confluence:
Daily Support + 4H Support + 1H Support = STRONG ZONE
Probability of bounce increases exponentially
2. Order Flow Confirmation:
Price at support + Large buy orders appearing = Strong signal
Use volume profile or order flow tools
3. Algorithmic Level Recognition:
In 2026, algorithms trade at "clean" levels
Round numbers, clear swing points get more action
4. News Impact on S&R:
Strong news can BREAK even major levels
Economic calendar is mandatory check
5. Seasonal S&R Patterns:
Certain levels hold during specific seasons
Example: Year-end support in December
📋 The S&R Trader’s Checklist
Before Trading:
-
Identify 3 key support levels
-
Identify 3 key resistance levels
-
Check higher timeframe context
-
Mark previous broken levels (role reversal)
-
Check economic calendar
During Trading:
-
Wait for price to APPROACH level (not at exact level)
-
Look for price action confirmation
-
Check for confluence with other factors
-
Set appropriate stop loss (below/above level)
-
Be patient – let price come to you
After Trading:
-
Review if level held or broke
-
Update levels based on new price action
-
Journal why trade worked/failed
-
Adjust future level drawing
🚀 Your 30-Day S&R Mastery Plan
Week 1-2: Observation
-
Don’t trade real money
-
Practice drawing S&R on 10 different charts
-
Focus on MAJOR levels only
-
Watch how price reacts at these levels
Week 3-4: Paper Trading
-
Execute 2 S&R trades daily on demo
-
Focus on bounces at major levels
-
Practice proper stop placement
-
Journal every trade
Month 2: Small Live Trading
-
Start with micro lots
-
Trade only at strongest confluence zones
-
Maximum 3 trades weekly
-
Focus on process over profits
🌟 Success Stories: Traders Who Mastered S&R
Case Study: Alex’s Transformation
2024: Lost $3,000 chasing indicators
Discovery: Learned pure price action S&R
Method: Focused on 3 key levels only
2025: Consistent 8% monthly returns
2026: Teaching others S&R strategies
Secret: "I stopped predicting and started reacting to price at levels"
Key Lessons from Winners:
-
Simplicity wins – Clean charts beat indicator overload
-
Patience pays – Wait for price to come to your level
-
Discipline matters – Follow your rules every time
-
Adaptability – Markets change, your levels should too
💭 Final Thoughts: The Trader’s Edge
Support and resistance aren’t just lines on a chart – they’re the market’s memory made visible. They show you where battles were fought and where they’ll be fought again.
Remember these truths:
-
The market speaks through price – S&R are its vocabulary
-
History rhymes – Price reacts at similar levels over time
-
Psychology drives markets – Fear and greed manifest at S&R
-
You don’t need to predict – Just react to price at levels
-
Mastery takes time – But the journey is worth it
“Amateurs look for complicated systems. Professionals look for simple levels where price has reacted before. Support and resistance give you that edge.” – FX Army Trading Philosophy
📱 Your First Action Step:
-
Open your trading platform
-
Switch to LINE chart (removes noise)
-
Draw yesterday’s high and low as resistance/support
-
Watch how price reacts at these levels today
-
That’s it – you’re trading with S&R!