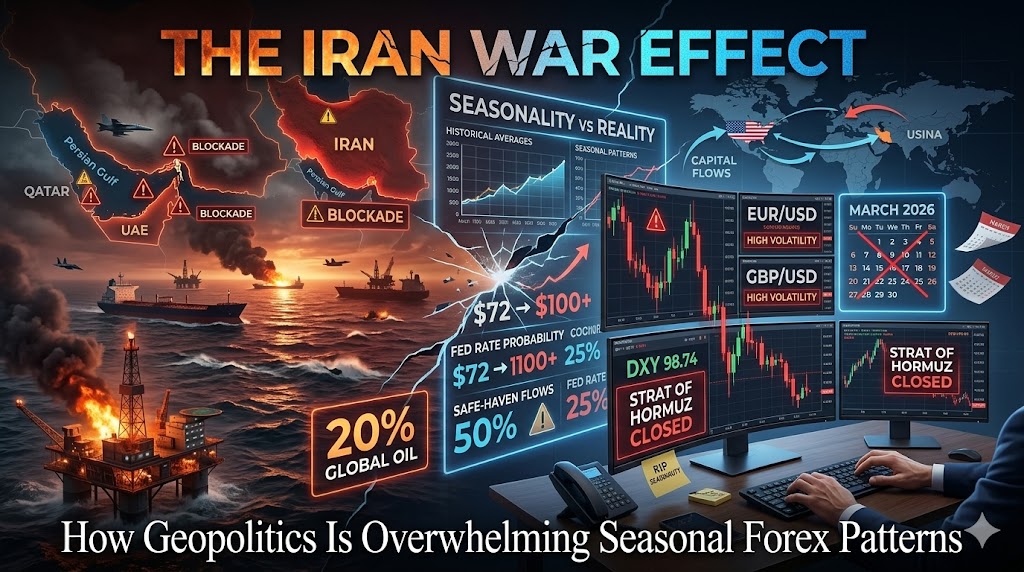


The Iran War Effect:
How Geopolitics Is Overwhelming Seasonal Forex Patterns
📅 The Seasonal Baseline: What March Usually Looks Like
Before the conflict erupted in late February, the seasonal playbook for March was relatively straightforward. Based on 50+ years of data since the Bretton Woods system collapsed in 1971, here’s what traders expected [citation:1]:
| Currency Pair | Historical March Average Return | Typical Pattern |
|---|---|---|
| EUR/USD | 0.0% | Mixed, non-committal |
| GBP/USD | +0.2% | Modestly bullish |
| USD/JPY | +0.1% | Slightly bullish |
| AUD/USD | -0.1% | Moderately bearish |
| USD/CAD | -0.1% | Modestly bearish |
These seasonal tendencies were always just historical averages, not guarantees. But in 2026, they’ve become almost completely irrelevant. As Matt Weller, Global Head of Research at FOREX.com, puts it: “Geopolitical developments in Iran and elsewhere are likely to dwarf the generally modest FX seasonal trends in March” [citation:1].
🔥 The Catalyst: Operation Epic Fury
On February 28, 2026, the United States and Israel launched “Operation Epic Fury,” a large-scale coordinated air campaign against Iran that killed Supreme Leader Ayatollah Ali Khamenei and numerous top IRGC commanders. Iran retaliated with drone and missile strikes against U.S. military installations across the Gulf. Bahrain, Qatar, the UAE, and Kuwait came under attack [citation:4].
The Republican Guard declared the Strait of Hormuz closed to commercial shipping—a catastrophic development, as tanker traffic through the Strait typically carries roughly 20% of the world’s seaborne oil flows, approximately 21 million barrels per day [citation:4][citation:8].
President Trump announced that the U.S. campaign in Iran would last at least 4-5 weeks, though conflicting signals have emerged about the timeline [citation:4][citation:9]. The uncertainty itself has become a market driver.
🧩 How Geopolitics Overwhelms Seasonality
The Iran conflict affects currency markets through three primary channels, each powerful enough to override historical seasonal tendencies [citation:2][citation:7]:
Energy Import Costs
Higher oil prices directly impact external accounts. The eurozone’s trade balance swung to near €50bn deficits during the 2022 energy crisis. Countries that import energy see their currencies weaken [citation:7].
Fed Rate Repricing
Oil-driven inflation forces markets to rethink rate cuts. One-year forward USD OIS rates bounced 25bp since the conflict began, supporting dollar strength [citation:7].
Stagflationary Shock
Markets were positioned for synchronized global growth. The conflict forces an unwind of these inflows, buoying the dollar as investors retreat to safety [citation:3][citation:7].
🌍 Major Pairs: Seasonality vs. Reality
EUR/USD: From Neutral to Vulnerable
March historically offered a neutral 0.0% average return for the world’s most traded pair [citation:1]. February saw among its smallest monthly trading ranges (<190 pips) in years. But the conflict has changed everything. As ING notes, “the eurozone monthly trade account swung to a near €50bn deficit by the late summer” during the 2022 energy crisis, and Europe’s energy dependence makes it particularly vulnerable now [citation:7]. The pair now trades with a massive “geopolitical risk premium” reflecting rising energy import costs [citation:8].
GBP/USD: Bullish Seasonality Meets Reality
Sterling’s historical +0.2% March average looks optimistic against current headwinds [citation:1]. Traders are watching the year-to-date low of 1.3340—a break below could open the door for more downside despite the modestly bullish seasonal trend [citation:1]. The UK’s energy import dependence makes it susceptible to the same terms-of-trade deterioration affecting Europe [citation:8].
USD/JPY: Defying Its Own Seasonality
USD/JPY has already been defying its usual seasonality this year, falling in January before edging back higher in February [citation:1]. The historical +0.1% March average means little when traders are weighing rising oil prices against safe-haven flows [citation:1]. Japan’s status as a massive energy importer clashes with its historical safe-haven reputation, creating extreme volatility [citation:8]. ING expects unilateral intervention from the Bank of Japan somewhere near 160 [citation:7].
AUD/USD: Uptrend vs. Seasonal Weakness
The Aussie historically drops -0.1% in March [citation:1]. But last month, it extended its January gains to test 3.5-year highs near 0.7150 before pulling back. COT positioning data shows multi-year highs in bullish speculative positioning [citation:1]. However, a broader risk-off move could trigger a pullback, though bulls will initially look to buy dips toward previous-resistance-turned-support in the mid-0.6900s [citation:1].
USD/CAD: The Petro-Currency Exception
March has been modestly negative for USD/CAD historically (-0.1%) [citation:1]. But the pair started March on a bullish foot, nearing the February high in the lower-1.3700s on safe-haven demand for the U.S. dollar [citation:1]. However, Canada’s status as a major oil exporter creates a tug-of-war: higher oil prices traditionally support the loonie, while safe-haven flows boost the greenback [citation:4][citation:8].
💵 The Dollar Narrative: From Bear to Bull
Perhaps the most dramatic shift has been in the dollar narrative. As recently as February, investors held their largest bearish bet on the dollar since 2021 [citation:3]. Expected Fed rate cuts gave little incentive to buy the greenback. But the conflict has completely reversed that positioning.
The dollar has hit its strongest level since November, driven by three factors [citation:3][citation:7]:
- Safe-haven demand – In a broad-based flight to safety, the greenback emerges stronger
- Energy independence – The U.S. is a net energy exporter, importing just 17% of its needs—a 40-year low [citation:3]
- Rate expectations – Oil-driven inflation has pushed markets to scale back rate cut expectations. Before the conflict, markets priced around 50% chance of a June cut; that’s now down to about 25% [citation:3]
As Bloomberg Intelligence notes, the dollar’s dual role as global reserve currency and net energy exporter provides a powerful buffer against the inflationary shocks radiating from the Persian Gulf [citation:2][citation:8].
📉 Emerging Markets: The Collateral Damage
Emerging markets have been hit particularly hard. MSCI’s emerging market currency index lost 1.5% last week, with sharp falls in strong year-to-date performers like South Korea’s Kospi [citation:3]. Goldman Sachs noted that de-risking was strongest in markets most exposed to the Middle East and oil shocks, such as Egypt, the UAE, and Thailand, as well as last year’s outperformers like Korea, Brazil, and South Africa [citation:3].
MUFG Research identifies oil-sensitive currencies like INR, PHP, and KRW as particularly vulnerable. If oil prices spike toward $90-$100 on a sustained basis, the pressure will intensify [citation:9]. JPMorgan moved EMEA emerging market FX to “marketweight,” adding Poland’s zloty to their “underweight” list, noting central and eastern Europe’s particular exposure to energy prices [citation:3].
⏳ The Duration Question: How Long Will This Last?
ING’s baseline assumes more settled energy markets by the end of the month, which would allow the dollar to hand back some recent gains. But a three-month-plus shock would be an entirely different, more bullish dollar matter [citation:7].
Standard Chartered similarly expects oil to spike toward $80 in the near term, with the medium-term outlook hinging critically on shipping access through the Strait of Hormuz. Oil prices could breach $100 should shipping become unsafe [citation:5].
The key variables to watch: whether the Strait of Hormuz remains closed, how long U.S. operations continue, and whether other regional actors are drawn into the conflict [citation:9][citation:10].
📊 Key Levels to Watch
| Pair | Key Level | Significance |
|---|---|---|
| EUR/USD | 1.1500-1.1600 | ING’s March target range [citation:7] |
| GBP/USD | 1.3340 | Year-to-date low; break could accelerate downside [citation:1] |
| USD/JPY | 155-160 | ING’s expected trading range [citation:7] |
| AUD/USD | 0.6900-0.6950 | Previous resistance turned support [citation:1] |
| USD/CAD | 1.3700 | February high; key resistance level [citation:1] |
| DXY | 98.3 / 98.74 | Next resistance / March 2 spike high [citation:4][citation:5] |
🎯 What This Means for Your Trading
1. Throw out the seasonal playbook
For March 2026, seasonal patterns are noise. Geopolitics is the signal. Focus on headlines, oil prices, and safe-haven flows [citation:1].
2. Watch the dollar’s dual role
The dollar benefits from both safe-haven demand and U.S. energy independence. Don’t fight the USD rally unless you see clear signs of de-escalation [citation:2][citation:3].
3. Consider petro-currencies
CAD and NOK offer upside exposure to oil without the safe-haven premium of the dollar. CAD/JPY and NOK/JPY crosses capture the divergence between energy exporters and importers [citation:8].
4. Be cautious on EM
Oil-importing emerging markets face a triple threat: higher import costs, capital outflows, and currency pressure. INR, PHP, and KRW are particularly vulnerable [citation:9].
“The U.S. dollar emerges as the biggest winner of the Middle East conflict. The U.S. economy will likely be more resilient to energy shocks.”
— Ipek Ozkardeskaya, Senior Analyst, Swissquote [citation:3]
💭 Final Thoughts
The Iran war has fundamentally altered the forex landscape for March 2026—and potentially beyond. Seasonal patterns that have held for 50+ years have been rendered irrelevant by the sheer magnitude of this geopolitical shock. The dollar’s resurgence, the vulnerability of energy importers, and the resilience of petro-currencies all reflect a new reality.
As ING’s Chris Turner puts it: “This year, investors have been positioning for growth. A stagflation Ary shock was not part of the plan” [citation:3]. The key question now is duration. A short-lived conflict may allow some reversion to previous trends. A prolonged confrontation could cement a new paradigm.
For traders, the lesson is clear: in March 2026, watch the Strait of Hormuz, not the calendar. Geopolitics has taken the wheel.
Trade the news, not the history books.
⚡ Geopolitics first. Seasonality second. ⚡
© 2026 · For traders navigating a world on fire