

Gold Bounces Back from Near One-Week Low; US Inflation Data in Focus
February 13, 2026 – Live Market Update
Gold prices have rebounded sharply during Friday’s Asian trading session, recovering from a brutal selloff that saw the precious metal plunge below the critical $5,000 per ounce level just 24 hours earlier.
As of 03:11 GMT, spot gold climbed 1.3% to trade at $4,982.59 per ounce, regaining ground after touching a near one-week low of $4,878 on Thursday. U.S. gold futures for April delivery rose 1.1% to $5,001.80 .
The recovery comes as investors engage in bargain hunting following the sharp decline, but all eyes are now firmly fixed on the U.S. Consumer Price Index (CPI) report due later today. This single data point will likely determine whether gold can reclaim the $5,000 handle or face renewed selling pressure .
– PRICE ACTION CHART
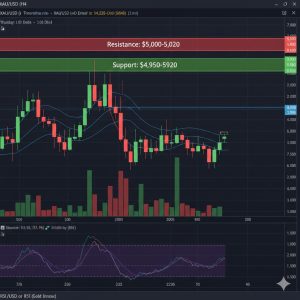
gold technical analysis February 13 2026 support resistance levels CPI data
What Happened? The Thursday Breakdown Explained
To understand today’s bounce, you must first understand Thursday’s crash.
Gold dropped approximately 3.2% on February 12, breaking decisively below the psychologically critical $5,000 per ounce level. The selloff accelerated once $5,000 gave way, triggering a cascade of stop-loss orders .
Three factors caused the breakdown:
1. Strong U.S. Jobs Data. Wednesday’s Non-Farm Payroll report showed the U.S. job market entered 2026 on much firmer footing than expected. January added 130,000 jobs, and the unemployment rate edged down to 4.3%. This reduced market expectations for aggressive Fed rate cuts .
2. AI Disruption Fears. Thursday’s equity rout was largely driven by “fresh fears about AI disruption” impacting major tech names like Apple. Gold sold off alongside equities as traders sold profitable positions to cover losses elsewhere .
3. Stop-Loss Cascade. According to market analysts, many traders had placed protective stop-loss orders just below the $5,000 level. Once price breached this support, “these stops were triggered, causing a chain reaction and sharp price decline in a short period” .
The Friday Bounce: Why Now?
Today’s recovery to $4,982 represents a $104 rebound from Thursday’s low. Three forces are driving this move:
1. Bargain Hunting. Professional traders view sub-$5,000 gold as a discount. The breakout below the psychological barrier was violent but brief, attracting buyers who had been waiting for a pullback .
2. Dollar Weakness. The U.S. Dollar Index remains capped near two-week lows. Dovish Fed expectations are limiting dollar upside, which supports gold priced in greenback .
3. Jobless Claims Data. Thursday’s unemployment claims came in at 227,000, slightly higher than the 222,000 expected. Continuing claims rose to 1.862 million, highlighting “underlying weakness in the labor market” that keeps rate cut hopes alive
FED RATE CUT PROBABILITY
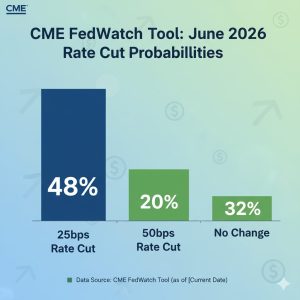
Fed rate cut probability June 2026 gold price inflation data February 13
The Big Event: US CPI Data – What to Expect
All eyes are now on the U.S. inflation report, due for release today, February 13, 2026.
| Scenario | Inflation Outcome | Gold Reaction |
|---|---|---|
| Bullish Case | Core CPI < 2.5% | Gold breaks $5,000, targets $5,090-5,100 |
| Neutral Case | Core CPI 2.5-2.7% | Consolidation $4,950-5,020 |
| Bearish Case | Core CPI > 2.7% | Re-test $4,900, possibly $4,850 |
Market consensus expects core CPI at 2.6% .
Why this matters: Gold is a non-yielding asset. When inflation falls and rate cut expectations rise, the opportunity cost of holding gold decreases. This is the single most important relationship driving gold prices in 2026 .
Technical Levels Every Trader Must Watch
As of February 13, 2026 – Live Levels
Immediate Resistance: $5,000 – $5,020
Major Resistance: $5,090 – $5,110 (breakout would open $5,200)
Immediate Support: $4,950 – $4,920
Major Support: $4,878 (Thursday low) – $4,850
RSI (14): 44.72 – neutral, room for upside
MACD: Turning higher near zero line, histogram positive
Analyst Note: “If gold today rises and stays below $4,975, the downside target remains $4,849–$4,752. Only a daily close above $5,070 would invalidate the bearish structure” .
How to Trade Gold Around CPI: 3 Practical Strategies
For traders watching today’s CPI release, three approaches make sense:
Strategy 1: Pre-Data Caution
Do nothing until the numbers print. Volatility will spike immediately after the 8:30 AM EST release. Wait 15-30 minutes for the initial chaos to settle, then trade the confirmed direction.
Strategy 2: The Breakout Play
If CPI comes in below 2.5% and gold breaks above $5,020 with strong volume, a retest of $5,090 becomes likely. Entry above $5,025, stop below $4,980.
Strategy 3: The Dip Buy
If CPI is hot and gold re-tests $4,900 but holds above Thursday’s $4,878 low, this is a high-probability buy zone. Stop below $4,850.
Risk Warning: “Short-term volatility usually increases around data releases. Tight stop losses and position sizing according to risk profile are recommended” .
What Professional Analysts Are Saying
Kyle Rodda,
“The precious market will eventually continue to trend higher over time, but with volatilities as heightened as they are and these big round levels offering indicators of where positioning might be, big breaks certainly accelerate these moves” .
Jateen Trivedi, LKP Securities:
“Technically, CME Gold has support around $5,025, while resistance is placed at $5,090–$5,110. All eyes are now on US CPI data due Friday evening, which could set the next directional move for gold” .
Fawad Razaqzada, City Index:
“Many investors had placed stop-loss orders below $5,000 or above $5,100 to protect positions. As prices fell, these stops below $5,000 were triggered, causing a chain reaction” .
The Bigger Picture: Why 2026 Gold is Different
Three structural forces are reshaping the gold market in 2026:
1. The $5,000 Threshold. Gold has permanently re-priced. The decades-old $2,000 ceiling is now $5,000 support. This psychological shift means institutional allocation models are being rewritten.
2. AI and Algorithmic Acceleration. Thursday’s 3% drop happened in minutes, not hours. Algorithms now dominate price discovery. Stop-loss clusters at round numbers ($5,000) create violent, self-reinforcing moves .
3. Fed Policy Uncertainty. With Chair Powell’s term ending in May 2026, markets are pricing policy uncertainty into gold. The transition to a new Fed leadership adds volatility premium .
What to Watch Next
Beyond today’s CPI, these February 2026 dates matter:
February 14: New York Fed President Williams speech – “FOMC Vice Chair” comments on inflation progress
February 16: U.S. Retail Sales – Consumer health indicator
February 20: FOMC Meeting Minutes – Markets will parse every word for “quantitative” guidance on rate cuts
Summary: Gold on the Knife’s Edge
Gold has successfully bounced back from its near-one-week low, reclaiming nearly two-thirds of Thursday’s catastrophic losses. $4,982 is not $5,000, but it’s close enough that today’s CPI data will determine whether the psychological barrier becomes resistance or support.
Bull Case: Weak inflation → Rate cut expectations rise → Dollar falls → Gold breaks $5,100 → Next stop $5,200
Bear Case: Sticky inflation → Fed holds firm → Dollar strengthens → Gold re-tests $4,850 → Range bound until March
For now, the smartest position is no position. Wait for the data. Let the market show its hand. Then trade accordingly.