- NZD/USD fell further, dropping below 0.6000.
- The oversold RSI points to a possible recovery but the downside is still strong.
- The pair is trading at lows not seen since August.
The NZD/USD pair extended its downtrend as bears maintained firm control amid intensifying selling. The pair fell 0.60% to 0.5980 during Friday’s trading session, hitting a new low since August. The 20-day simple moving average (SMA) is also about to complete its uptrend with the 100-day moving average, which will prompt selling.
The relative strength index (RSI) is in oversold territory, currently at 30, indicating strong selling. The downtrend in the RSI suggests that the bearish period will continue, followed by the rising red line on the Moving Average Convergence Divergence (MACD) bar chart. However, the RSI in the oversold territory could lead to a bullish correction as sellers begin to lose momentum.
NZD/USD daily chart
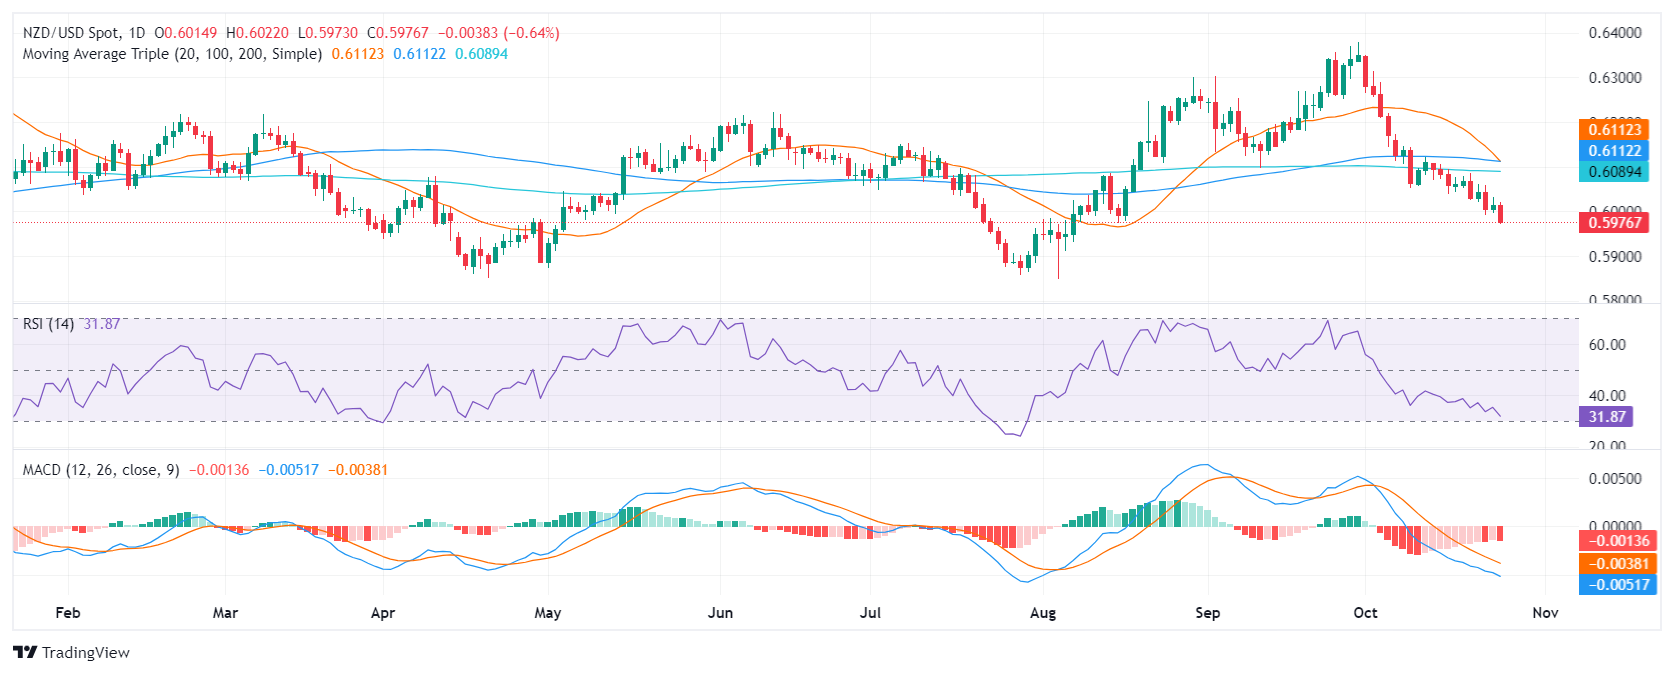
Technically, NZD/USD continues to trade below its major moving averages, with the 100-day simple moving average (SMA) around 0.6100 and the 200-day SMA around 0.6150 creating significant resistance. These issues are limiting the partner’s upside recovery potential.
Support levels: 0.5950, 0.5930, 0.5900.
Resistance levels: 0.6000,0.6050, 0.6100.