


- NZD/USD can be exposed to immediate resistance from 9 days of EMA of 0.5737.
- The 14-day RSI is under the 50 mark, pointing to weak bullish dynamics.
- Waste under the 50-day EMA of 0.5718 could further damage average strength.
NZD/USD Price Action: Retracing Recent Gains
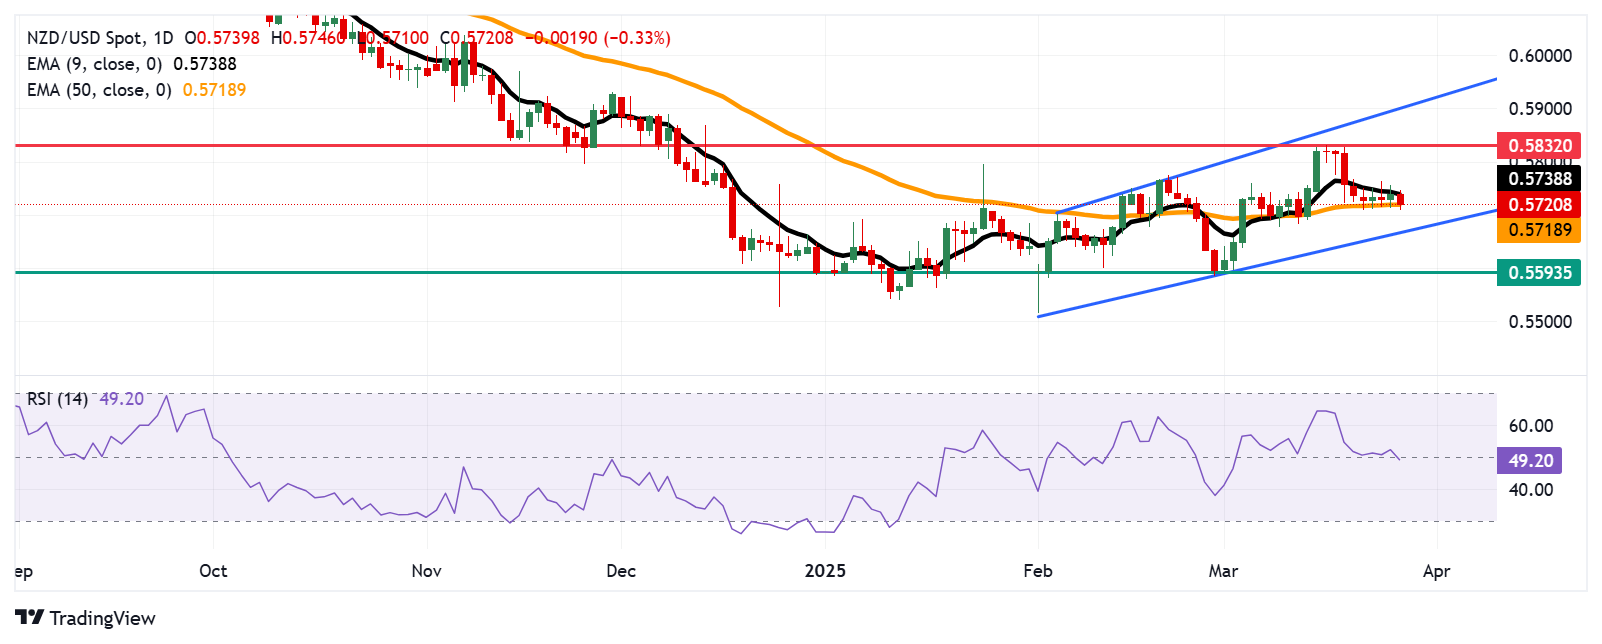
The NZD/USD pair has pulled back from its recent gains in the previous session, hovering around 0.5720 during early European trading on Friday.
Technical Analysis: Mixed Signals in Momentum
Despite staying within an ascending channel pattern, the daily chart analysis indicates weakening bullish momentum. The 14-day Relative Strength Index (RSI) has slipped below the 50 level, signaling potential downside risks. Additionally, the pair is trading below the nine-day Exponential Moving Average (EMA), suggesting weaker short-term momentum.
Broader Trend Remains Bullish
While short-term momentum appears fragile, the broader trend remains bullish, as the nine-day EMA is still positioned above the 50-day EMA. This setup suggests that a potential recovery is still on the table.
Upside Potential and Key Resistance Levels
If the NZD/USD pair decisively breaks above the nine-day EMA at 0.5738, short-term momentum could strengthen, pushing prices toward the three-month high of 0.5832, last recorded on March 18. Further resistance is located near the upper boundary of the ascending channel at approximately 0.5900.
Downside Risks and Key Support Levels
A drop below the 50-day EMA at 0.5718 may weaken the medium-term outlook, increasing downward pressure. In such a scenario, the NZD/USD pair could test the psychological support at 0.5700, followed by the lower boundary of the ascending channel at 0.5670. A breakdown below this level would reinforce bearish sentiment, with the next major support at the monthly low of 0.5593, recorded on March 3.
NZD/USD:Chart
New Zealand Dollar PRICE
The table below presents the percentage change of the New Zealand Dollar (NZD) against major global currencies for today. Among them, the NZD recorded its largest decline against the Japanese Yen.
| USD | EUR | GBP | JPY | CAD | AUD | NZD | CHF | |
|---|---|---|---|---|---|---|---|---|
| USD | 0.13% | 0.04% | -0.26% | 0.14% | 0.30% | 0.47% | 0.06% | |
| EUR | -0.13% | -0.12% | -0.44% | -0.01% | 0.14% | 0.32% | -0.09% | |
| GBP | -0.04% | 0.12% | -0.31% | 0.11% | 0.26% | 0.44% | 0.02% | |
| JPY | 0.26% | 0.44% | 0.31% | 0.40% | 0.56% | 0.74% | 0.33% | |
| CAD | -0.14% | 0.01% | -0.11% | -0.40% | 0.15% | 0.32% | -0.08% | |
| AUD | -0.30% | -0.14% | -0.26% | -0.56% | -0.15% | 0.17% | -0.24% | |
| NZD | -0.47% | -0.32% | -0.44% | -0.74% | -0.32% | -0.17% | -0.41% | |
| CHF | -0.06% | 0.09% | -0.02% | -0.33% | 0.08% | 0.24% | 0.41% |


